• Skip to primary navigation
  • Skip to main content
  • Skip to primary sidebar
Antichaos

Antichaos

Data Visualisatie, Tableau & Data Services

  • Home
  • Blog
  • Diensten
  • Training
  • Portfolio
  • Contact
  • English
  • Show Search
Hide Search
Home » Portfolio

Portfolio

Een aantal voorbeelden van dashboards die ik gemaakt heb:

Visual Portfolio, Posts & Image Gallery for WordPress

Top 2000 | Radio 2 NL | 2024

Let there be Drama!

Look who’s talking

Weather Forecast

The Big Mac Index

Christmas Movie Marathon

Laad meer Laad meer… Het einde van de lijst

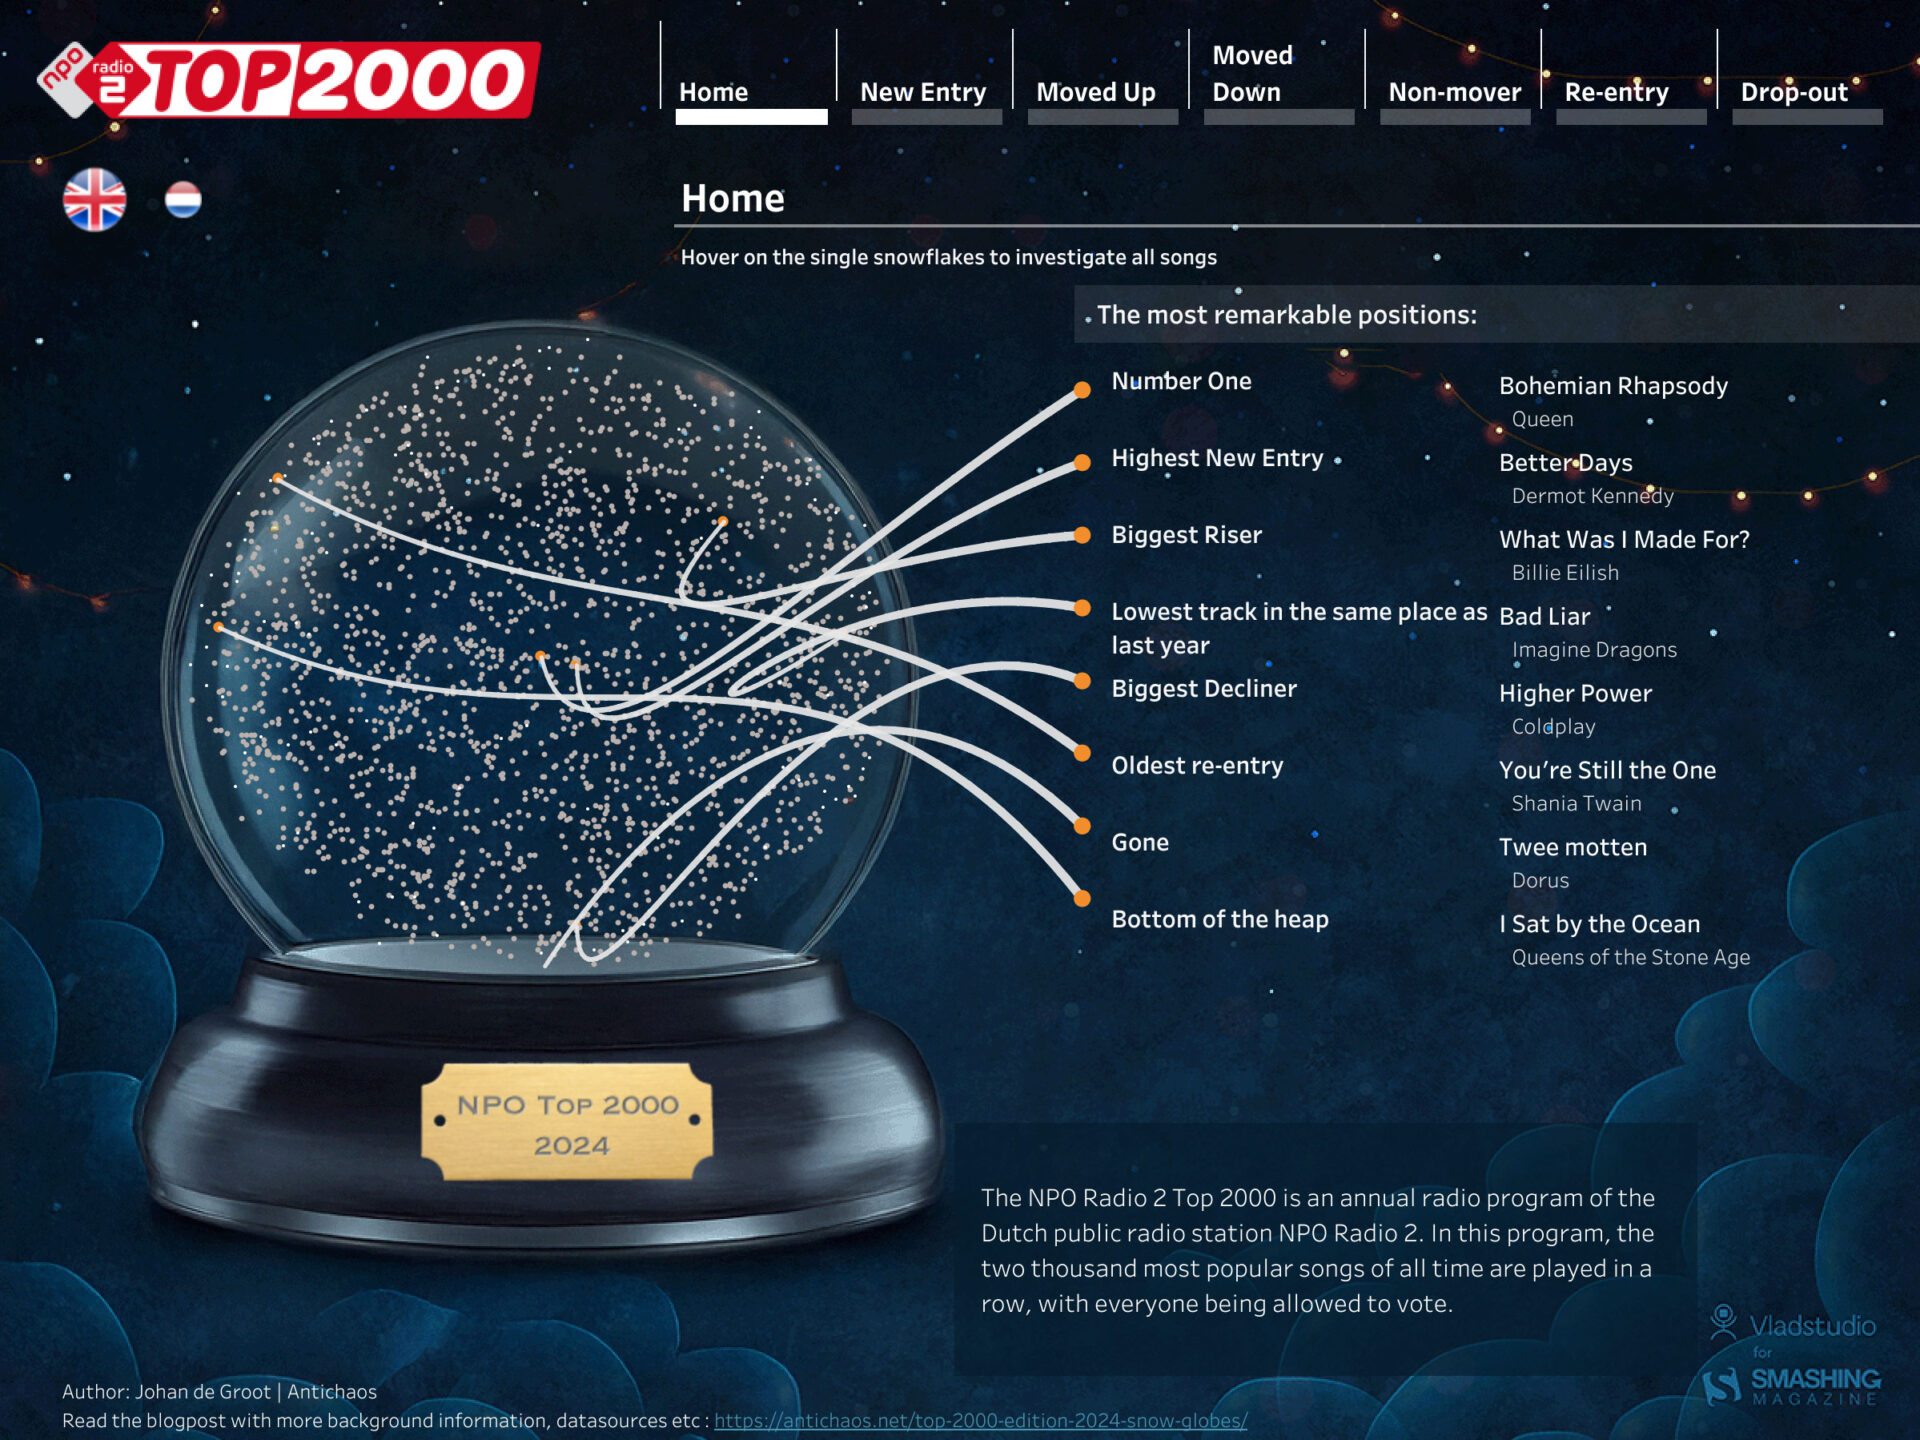
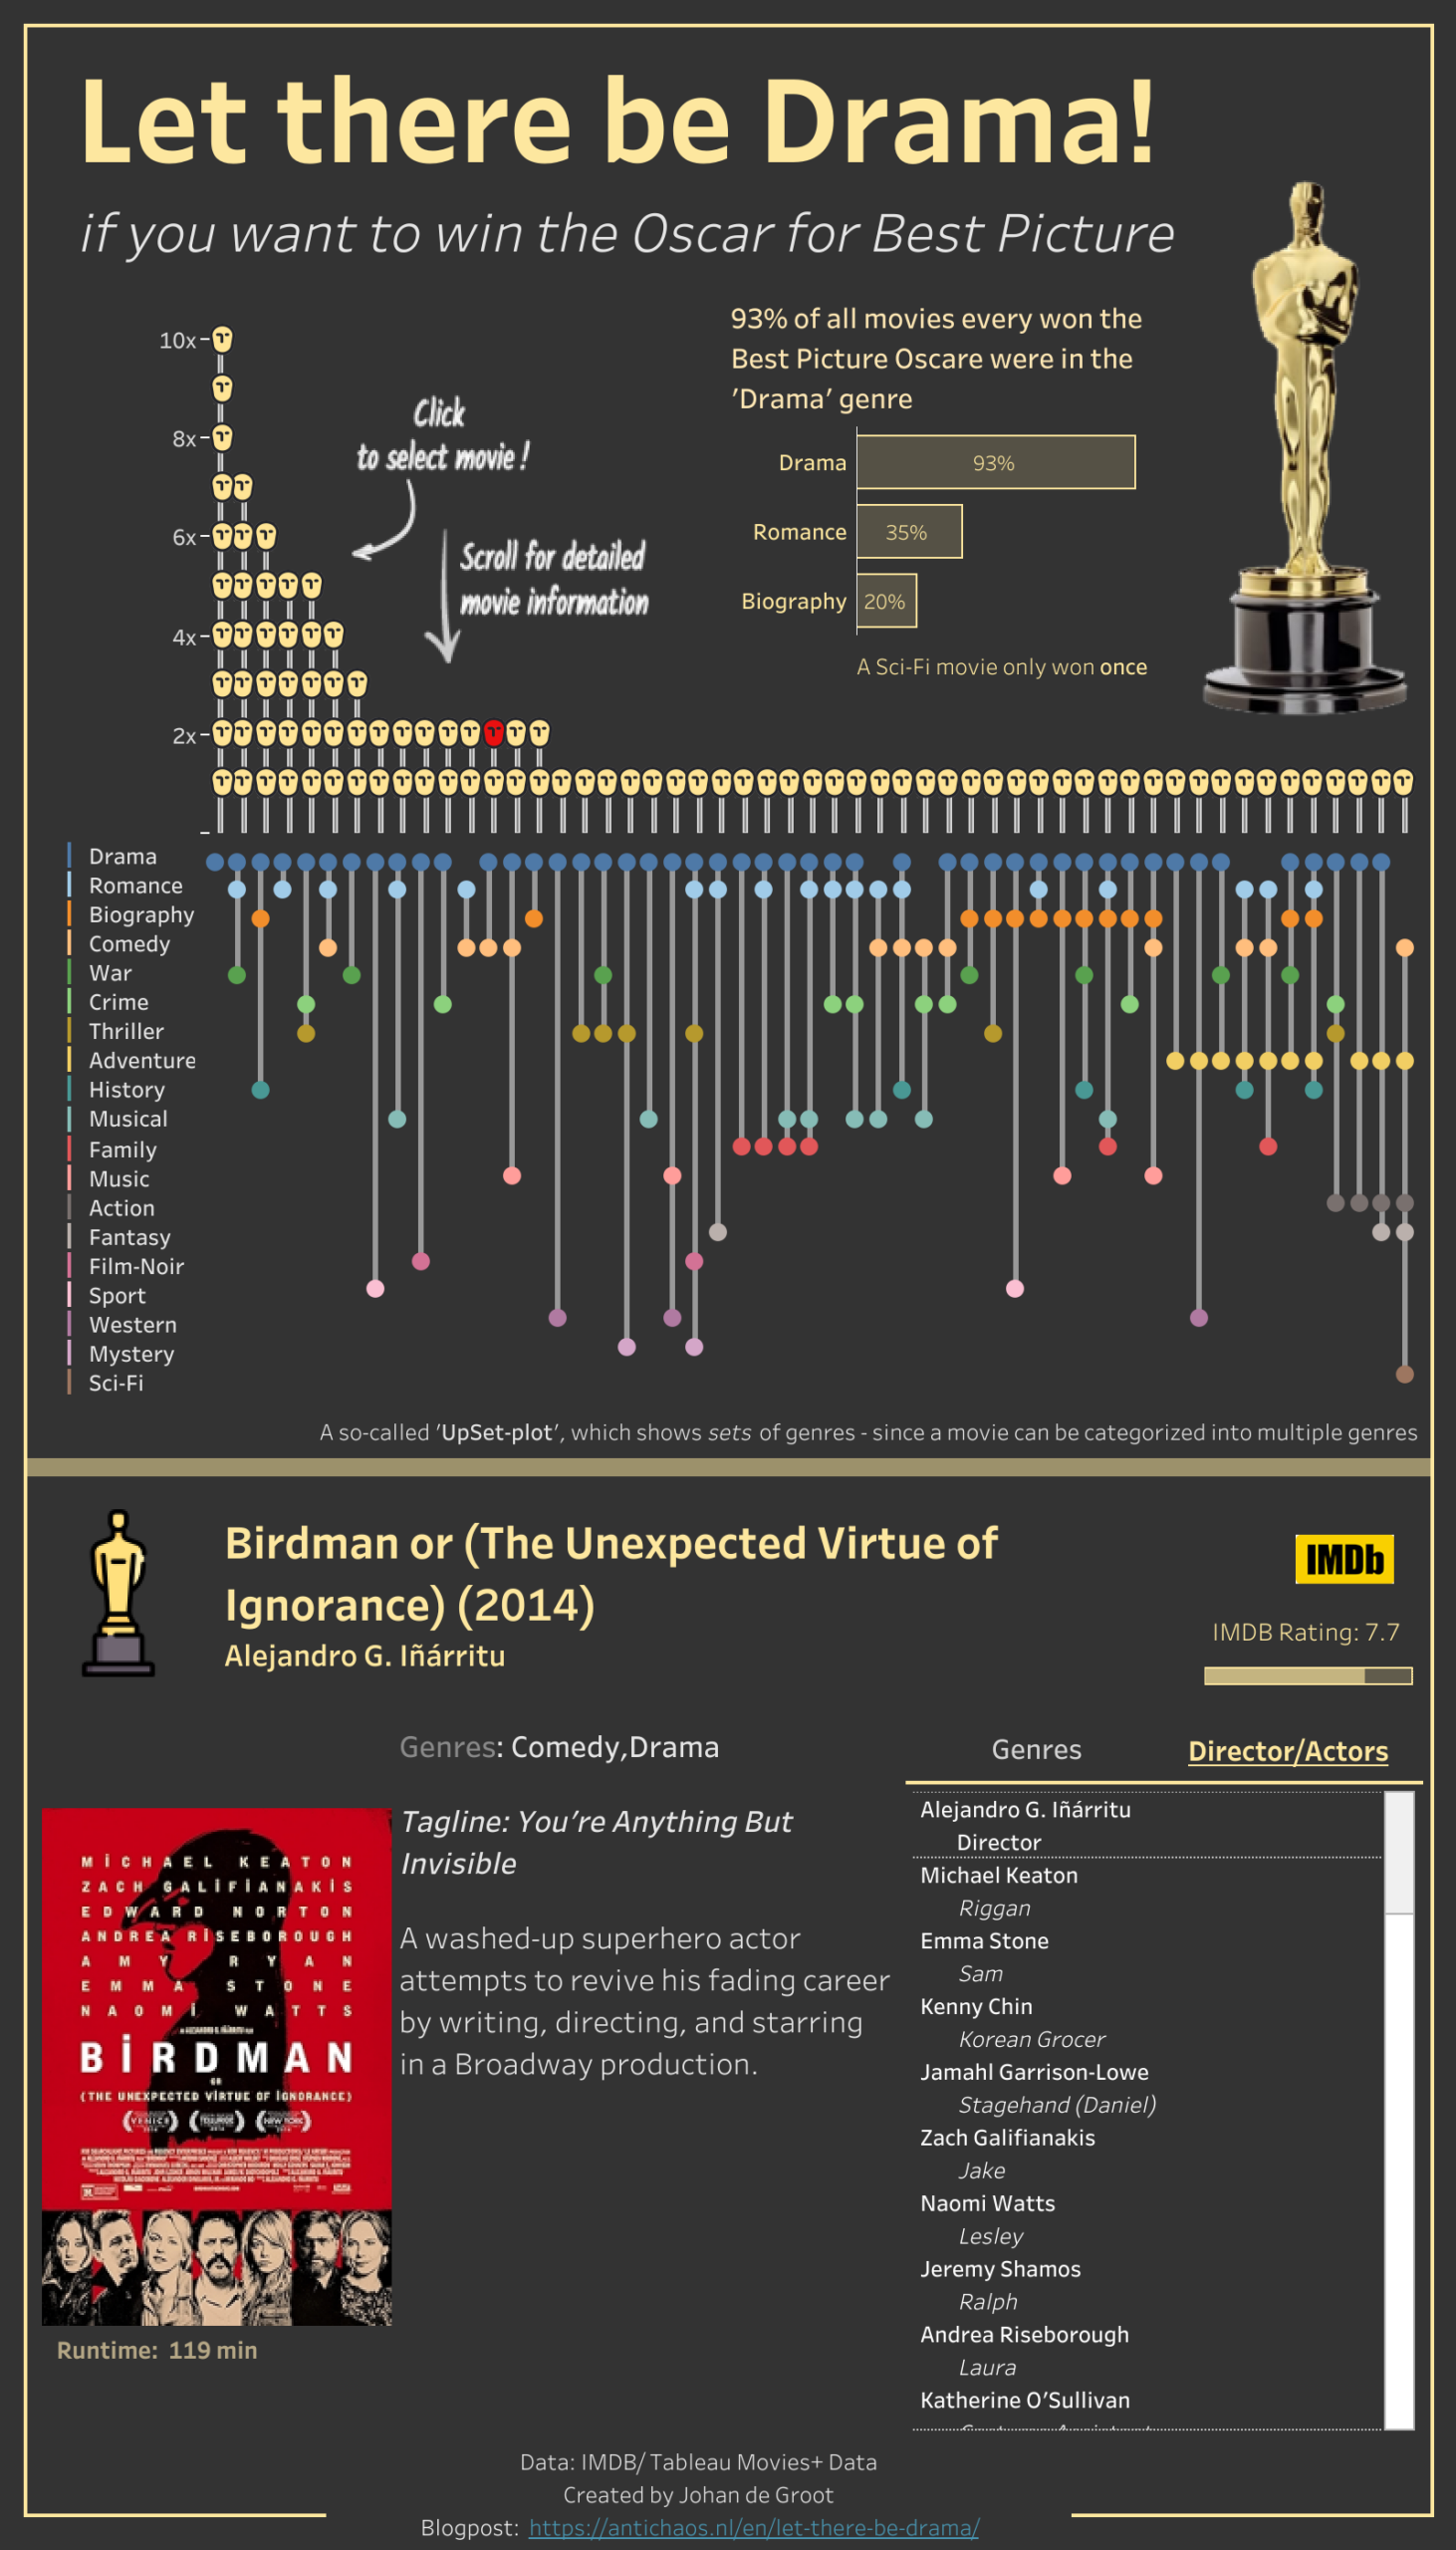
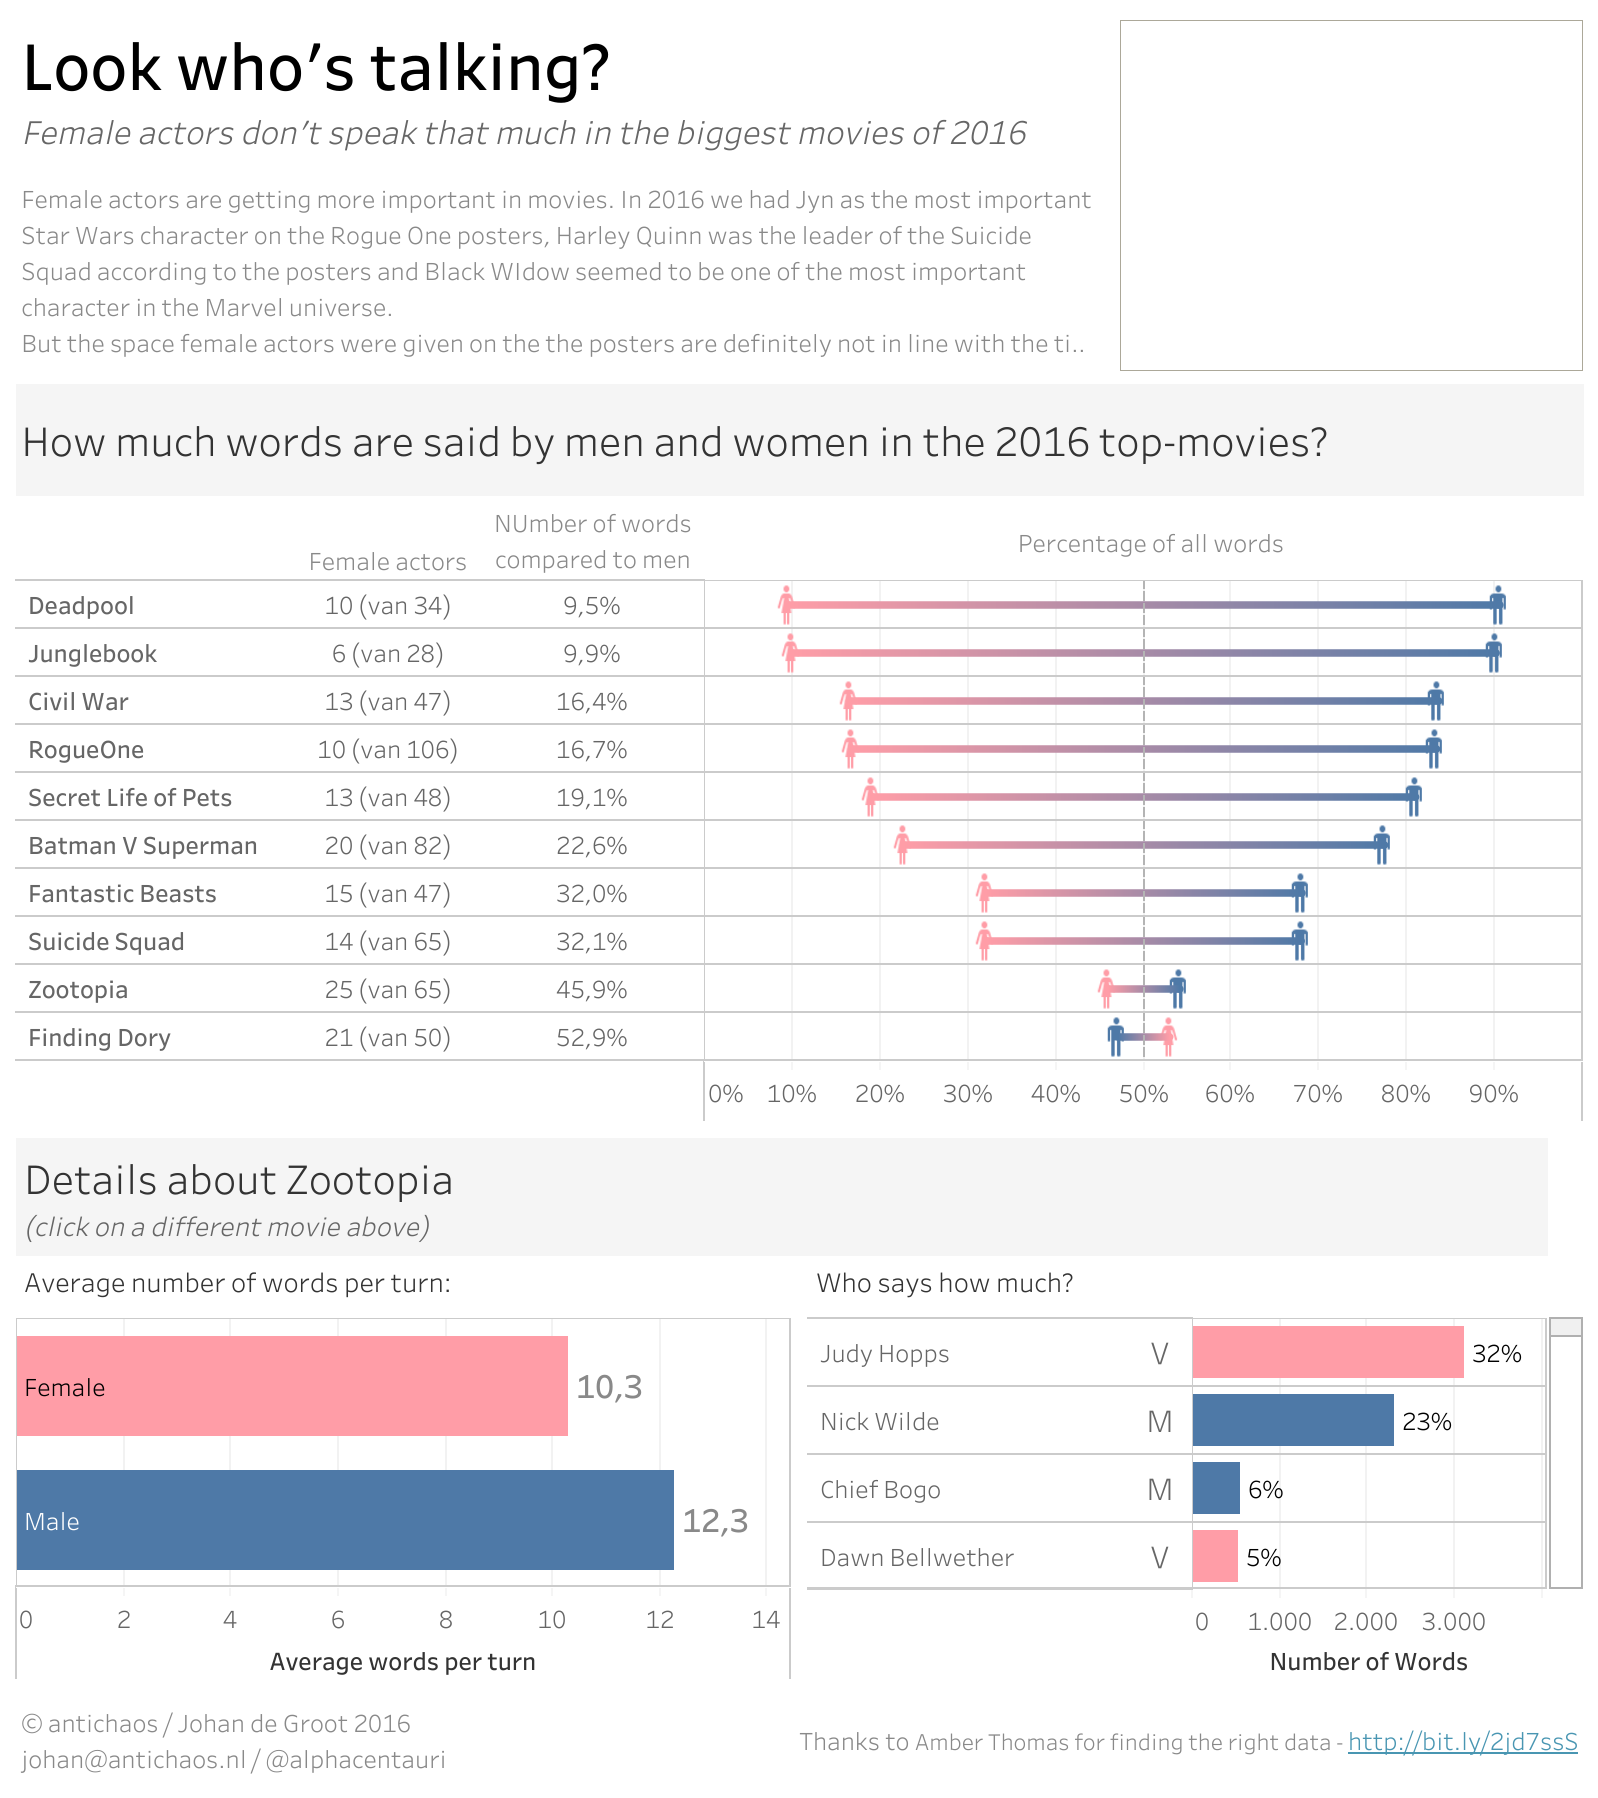
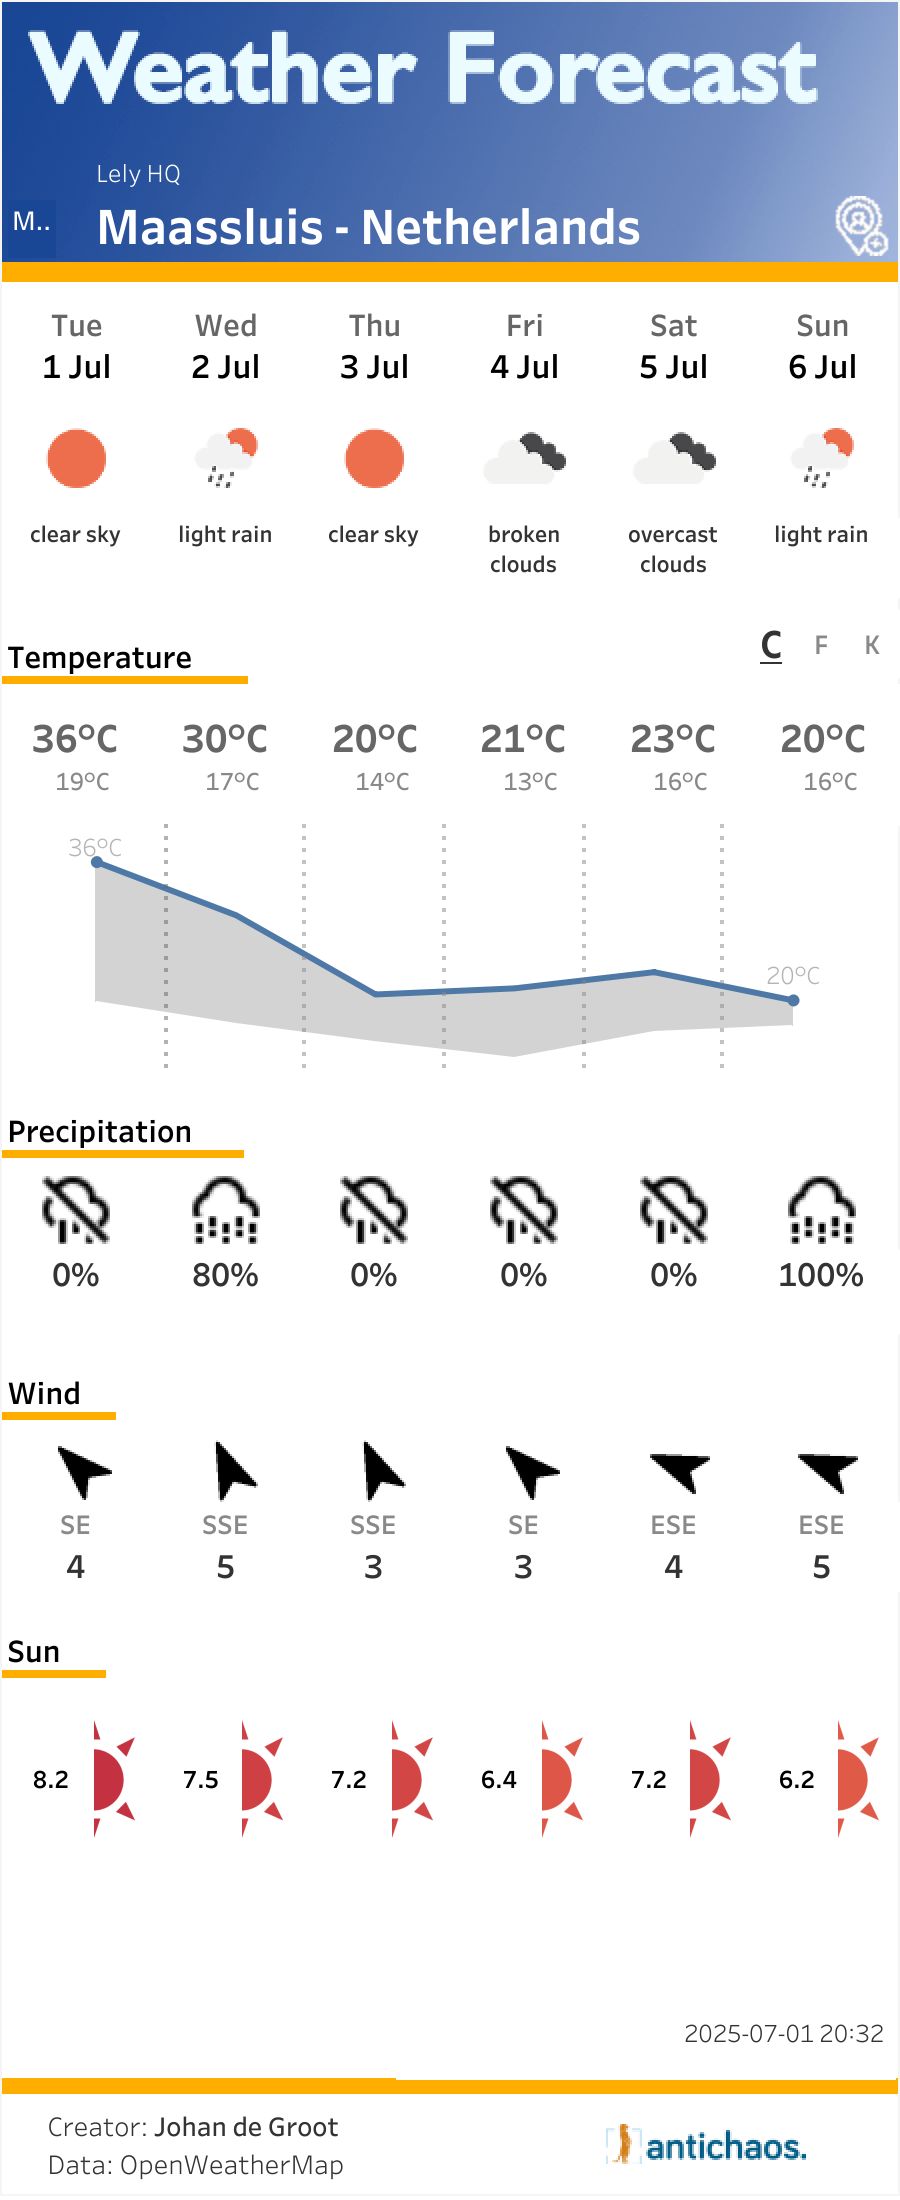
Neem even contact op voor een uitgebreider portfolio, of vragen!

Primary Sidebar

Antichaos Services

  • Need Tableau Help ?
  • Basic, Advanced and Custom Training

RSS Blog

  • Tableau REST API Connector: Add Live Web Data to Your Dashboards
  • Rounded Corner Maps in Tableau
  • Improving Radar Charts: Showing Overview and Details
  • Create a Radarchart in Tableau – Modular and Simple
  • Radar Charts: Practical tips for when and how to use them
  • Smarter dashboard design – with fewer tooltips
  • Top 2000 in Perspective – Behind the Scenes
  • How to Visualize High-Value Metrics in Tableau Without Starting at Zero
  • Why is COUNTD so slow – and how can I fix this?
  • Visualizing ‘Dynamic’ Data using a Sine Wave

Antichaos

Copyright © 2026 Antichaos

  • Home
  • Blog
  • Diensten
  • Training
  • Portfolio
  • Contact
  • English