De 25e keer is de Top 2000 van Radio 2 uitgezonden – en traditiegetrouw probeer ik hier weer een ‘andere’ interactieve datavisualisatie van te maken…
Antichaos
Tableau Consultancy & Analytics
De 25e keer is de Top 2000 van Radio 2 uitgezonden – en traditiegetrouw probeer ik hier weer een ‘andere’ interactieve datavisualisatie van te maken…
De Top 2000 zoals uitgezonden door Radio 2 heb ik gevisualiseerd met behulp van Tableau.
Dit jaar wat minder nadruk op een de vorm (hoewel ik heb gekozen voor een gedempte sinus, wat niet bepaald een veelgebruikte manier van weergeven is…).
[Read more…] about De Top 2000 van 2022 gevisualiseerdTableau has created a nice blog post on Tableau Forum Ambassadors. It describes what these ambassadors do, how they can be used on the Tableau journey,
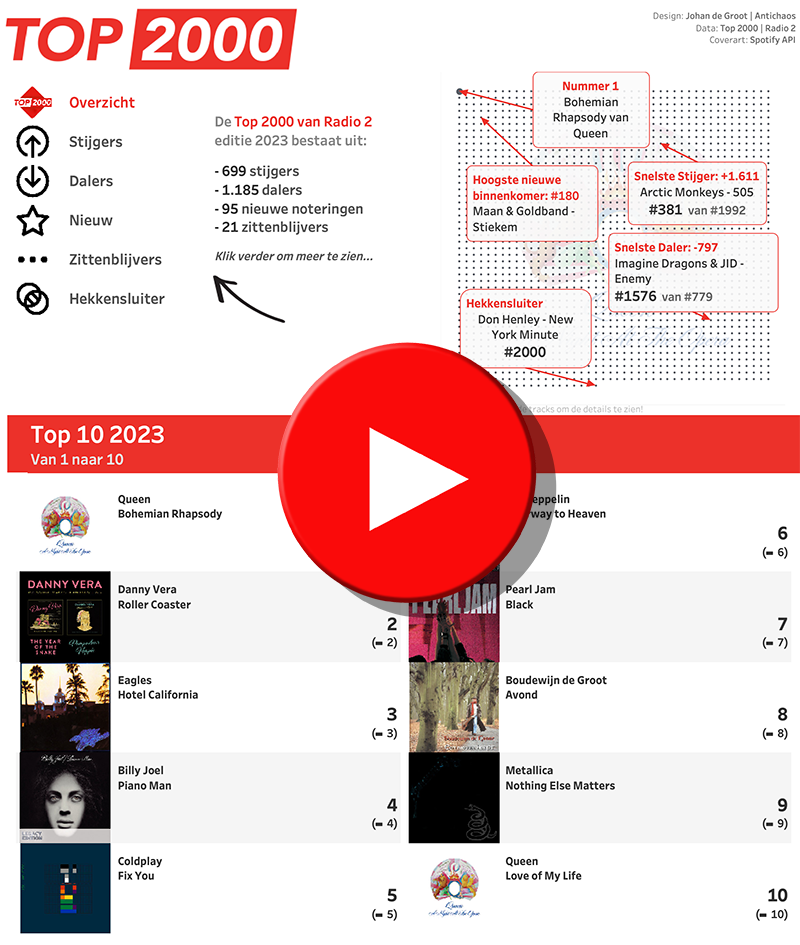
[Read more…] about Featured Forum AmbassadorHet is weer die tijd van het jaar – de Visualisatie van de Top 2000 van Radio 2…
De Top 2000 zoals uitgezonden door Radio 2 heb ik voor de 10e keer (geloof ik) op een andere manier gevisualiseerd met behulp van Tableau.
Dit keer is er gekozen voor een circulaire weergave van de lijst van dit jaar, met een ‘detail’ van het gekozen nummer in de cirkel. Je kunt een nummer kiezen uit het dropdown menu, maar ook klikken in de cirkel of in de lijst met noteringen van de desbetreffende artiest.
Honored and proud to be selected a 2021 Tableau Ambassador!
Looking forward to work, learn and share ‘all things Tableau’ with even more people. Thanks Tableau, and congratulations to all new and returning Tableau Ambassadors.
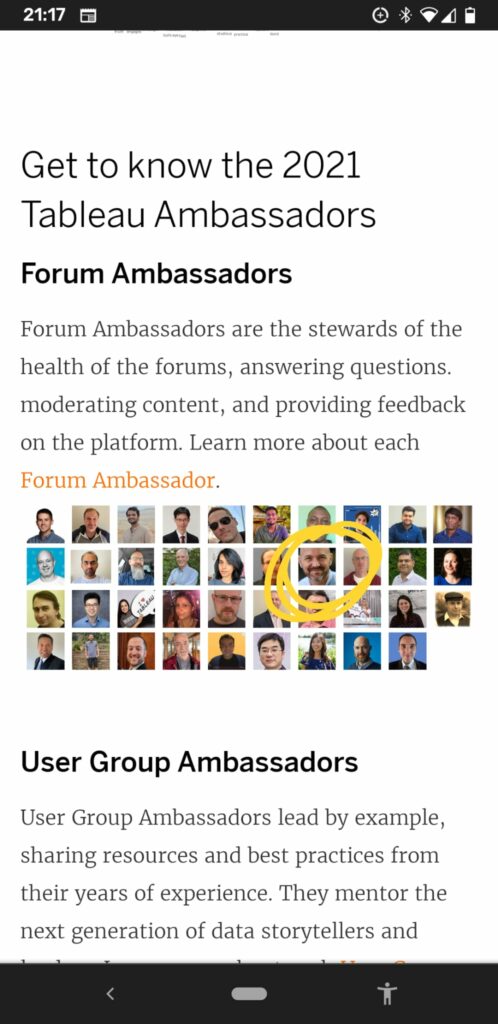
More information on all Tableau Ambassadors 2021 can be found here: https://www.tableau.com/about/blog/2021/9/congratulations-and-welcome-2021-tableau-ambassadors