It’s just a couple of weeks before TC24 in San Diego… So we want to know what the weather is out there!
Or at home. Or any other place in the world.
What better than building your own weather forecast in Tableau!?
Antichaos
Tableau Consultancy & Analytics
It’s just a couple of weeks before TC24 in San Diego… So we want to know what the weather is out there!
Or at home. Or any other place in the world.
What better than building your own weather forecast in Tableau!?
Datefilters are one of the most common filters on any dashboard. They are needed to see trends, make decisions on the right period, and analyse within the right context. But most of the times these filters are not optimal – so let’s make them better (and prettier)
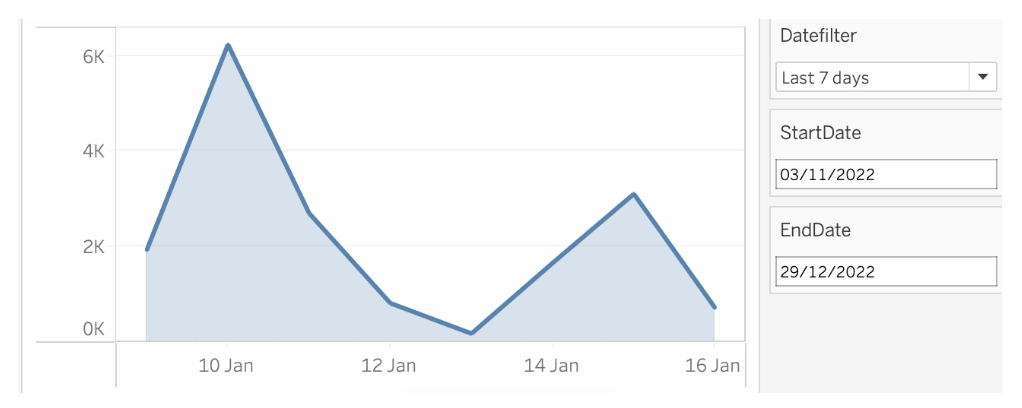
[Read more…] about Better datefilters in Tableau
I visualized the Top 2000 as broadcast by Radio 2 for the 11th time (I believe) in a different way using Tableau.
[Read more…] about The Radio Top 2000 visualised – edition 2022The order of operations in Tableau refers to the sequence in which the software processes the data and calculations in a given worksheet or visualization.
The order of operations in Tableau is the order in which Tableau performs its various actions. An action is mostly identified as a filter, but can also be a calculation or another Tableau feature which is computed.
This is Tableau’s Order of Operations:
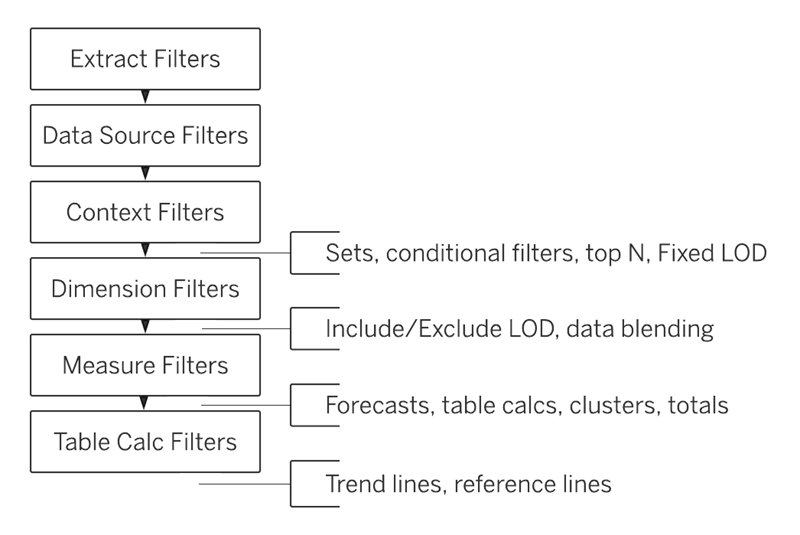
It shows in which sequence filters are handled with by Tableau: first extract filters, than datasource, context, dimension, measure and table calculation filters. The ‘inserts’ on the right are
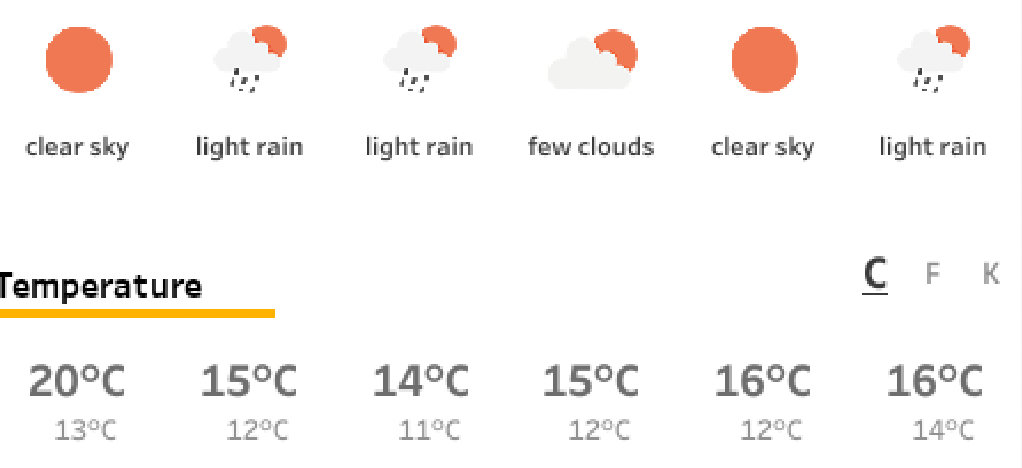
The most talked about topic in the world is probably the weather. And if you want to talk about, you need to know the data 😉
This dashboard show the weather forecast in my location for today and the next 4 days.
[Read more…] about Weather Forecast in Tableau