Showing the Skylines of cities in Tableau – one by one.
[Read more…] about Moving Skylines of the Worldblog-en
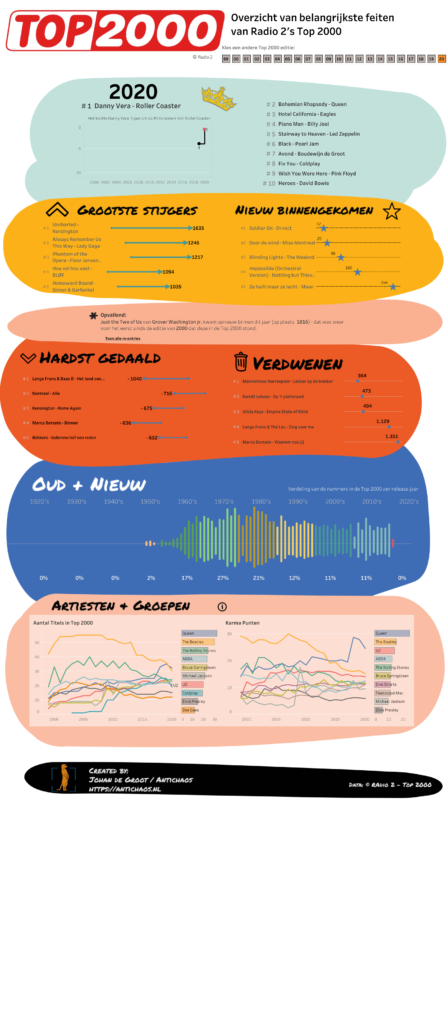
Top 2000 visualisation – edition 2020
The Top 2000 edition of 2020 isn’t a fancy data visualisation with extensive data-preparation and/or mathematical formulas like last year, but a visualisation with the emphasis on what you can do with relative simple graphical elements. This approach can change the look and feel of a ‘standard’ dashboards significantly
Click on the screenshot to view – and use! – the data visualisation fullscreen.
Top 2000 van Radio 2 — 2019
Ieder jaar maak ik op basis van de laatste Top 2000 lijst van Radio 2 een nieuw (aantal) visualisaties.. De lijst zelf is niet heel erg spannend, dus is het interessant om te zien wat je met de data kunt doen…
